
PYMNTS Global Fraud Index Delivers Latest 2017 Fraud Stats
Check Out What Trends are Uncovered in this Quarterly eCommerce Report
One of the best third-party sources for eCommerce fraud data is the PYMNTS Global Fraud Index™. This quarterly report offers a concise look at current fraud trends, allowing us to examine and predict developing threat sources and gauge their impact on the market.
In this article, we examine up-to-date 2017 fraud stats and key Q1 findings, and reveal what they mean for the eCommerce environment.
Current eCommerce Fraud Rates
The Q1 2017 study examined eight industries, which represent roughly 63% of the eCommerce market. These include:
- Apparel
- Consumer Electronics
- Cosmetics
- Department Stores
- Furniture & Appliances
- Health & Leisure
- Jewelry
- Tobacco, Cannabis, & Alcohol
Researchers saw an overall fraud increase in these sectors compared to last year. Total fraud losses totaled an estimated $48.2 billion across all eight industries. Much of that increase relates to rising average order values.
| Price Range | % of Transactions Identified as Fraud |
| Less than $100 | 0.52% |
| $100-500 | 3.87% |
| More than $500 | 10.93% |
Until recently, brick-and-mortar sales dominated the upscale retail market. But as eCommerce gains a larger share of the consumer pie, shoppers are doing more of their upscale shopping online.
This represents extraordinary new opportunities for online profitability, but it also means increased vulnerability to fraud. As this table illustrates, reported fraud was over 20 times greater in high-value transactions than lower-value ones.
What About Friendly Fraud?
Confirmed cases of friendly fraud increased slightly in Q1 2017 compared to the same period the previous year. Now, roughly 0.07% of all transactions are identified as friendly fraud.
This was not universal across-the-board, however. In apparel, for example, confirmed friendly fraud reached 0.09% of all transactions—a 50% increase. Apparel also suffered the highest percentage of friendly fraud in high value transactions; 0.41% of all sales above $500 were later identified as friendly fraud.
The second-highest rate among industries surveyed were consumer electronics. Friendly fraud attacks in this industry nearly doubled from 0.04% in 2016 to 0.07%.
Of course, the actual impact of friendly fraud is likely much higher than this study can reflect. Friendly fraud’s defining characteristic is that it is difficult to identify; as a result, many crimes tend to go unreported.
“Last-Mile Fraud” On the Rise
The study revealed one unique fraud category that is quickly growing in popularity: last-mile fraud.
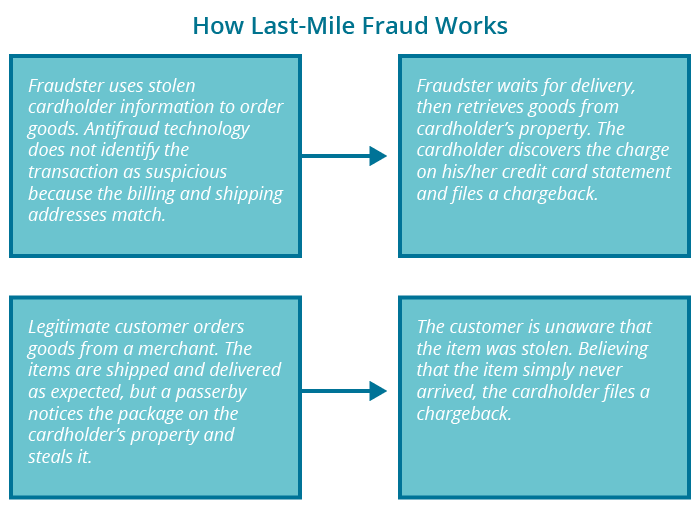
Last-mile fraud (alternately known as “front porch fraud”) occurs when a package is processed, shipped, and delivered, but is swiped from the cardholder’s property before the cardholder can claim it. As explained in the report:
“This has become a bigger issue in recent years, with customers even installing security cameras to catch thieves in the act. A growing number of customers are also receiving empty boxes implying delivery and postal service workers play a role in fraud as well. Despite the introduction of self-service lockers and pickup stations, most consumers still expect delivery of their online purchase at their homes and hold merchants responsible for any problems.”
It can be a crime of opportunity, or orchestrated by fraudsters to avoid detection by antifraud technology. Either way, the result is the same: cardholders pay for items they do not receive, and the merchant suffers the consequences.
Last-mile fraud is difficult to prevent. It’s possible to identify this threat source through two-step authentication techniques, but as with all fraud categories, there are no guarantees. For “crimes of opportunity,” there is little merchants can do beyond requiring signature confirmation for all deliveries. Unfortunately, this would dramatically inflate shipping costs, making it cost-prohibitive for many merchants.
| YoY Fraud Increase in 10 Most Populous States, as % of Overall Transactions | |
| 1. California | > 0.5% |
| 2. Texas | > 0.5% |
| 3. Florida | 0.2-0.5% |
| 4. New York | < 0.2% |
| 5. Pennsylvania | 0.2-0.5% |
| 6. Illinois | 0.2-0.5% |
| 7. Ohio | > 0.5% |
| 8. Georgia | 0.2-0.5% |
| 9. North Carolina | < 0.2% |
| 10. Michigan | < 0.2% |
Looking at Fraud by Locale
Breaking fraud attacks down to the state level yields good news and bad news.
The good news: A slight majority of US States saw fraud– as an overall percentage of eCommerce transactions– fall slightly in Q1 2017 compared to last year. The bad news is that the country’s most populous states saw the exact opposite.
Three of the country’s four most populous states—California, New York, and Florida—were identified as “fraud hotspots” in the report. Combined, these three states are the point of origin for a staggering 43.8% of all fraud attacks perpetrated in the US across all tracked industries.
Learn More in the Full Report
The above information is just a small sample of the information contained in the latest edition of the PYMNTS Global Fraud Index™. Click here to download the full report and gain deeper insight into the current state of eCommerce fraud.
Interested in learning more about the practices, trends, and technologies behind the Global Fraud Index report?
Our experts are standing by to help you interpret these latest 2017 fraud stats. Request more insight on the subject, or to learn how PDSCC helps address fraud and chargebacks to secure eCommerce sustainability.
Contact Us
Last Update: November 1, 2017
Tell us how can we improve this post?
Are you interested in a topic we haven’t covered yet? Use our Submit a Question feature to request additional information from our contributing experts.